Combatting the Urban Heat Island Effect with UAV Thermal Imaging – Part 3
In Part 2 of this series we identified the extensive agency coordination required to successfully stage and implement urban UAV missions, then outlined the technical post-processing platforms that began to reveal a vivid glimpse of the reality of the urban heat island effect. In Part 3 we will sculpt the ‘shape’ of a day in the urban heat island effect.
Just joining the conversation? The following links are a great place to start: Part 1 & Part 2.
SHAPING A DAY IN THE URBAN HEAT ISLAND
One of my personal goals for this study was to understand the ‘shape’ of a day in the urban heat island. That equated to scanning the corridor before sunrise (morning civil twilight), at peak sun (solar noon), and at sunset (evening civil twilight). Unfortunately, unexpected rain occurred just before the evening flights on my first two days of attempts, which was pretty deflating after staging and successfully completing both morning and afternoon flights those days. Precipitation compromises thermal analyses since it alters surface temperatures and impacts emissivity, while most UAVs are not capable of flying in inclement weather regardless.
In total I would conduct three days of flights with help from SmithGroup colleagues Steven Thomas and Tommy Reyna, finally achieving a successful full day of scans on what would become the third and final day.
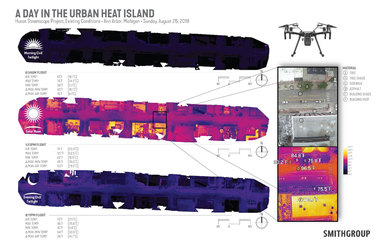
The chart above demonstrates what a day in the urban heat island looks like. The findings are what you might expect, but instead of a qualitative assessment we get a very quantitative glimpse of what is happening.
A few of the most interesting trends I have observed thus far:
- The urban heat island effect is considerably worse on hot days than it is on warm days. For instance, I observed disparities of nearly 80°F between ambient air temperature and asphaltic surfaces on a sunny 84°F day with low wind, but that disparity reduced to 55°F on a sunny 74°F day with low wind. That is almost a 30°F change in surface temperature from just 10°F change in air temperature. In other words, if global temperatures are on the rise, cities will begin to feel much hotter in summer months than they already do today, especially if nothing is done.
- Materials retain heat long after the sun goes down. Average evening surface temperatures measured more than 10°F warmer than immediately pre-dawn surface temperatures. In the urban environment, do not expect the sunset to bring relief from the urban heat island effect.
- Canopy and shade matter. Areas of constant building shade, trees and deep tree shade typically measured within a few degrees Fahrenheit of the air temperature, while areas directly or partially exposed to solar gain typically measured 20°F warmer or more, in some areas upwards of 80°F warmer. With this data I have been able to recalibrate conventional urban design approaches to maximize dimensional criteria for facets like building and tree spacing, sizing, and materiality choices within the urban environment. There will be a lot more to come on this.
This is the third installment of what will continue to unfold in coming months and years as data and forthcoming analyses reveal more. The next installment breaks down the existing streetscape corridor by thermal surface area to exhibit the physical scale of the urban heat island effect. Want to see more? Follow SmithGroup on LinkedIn and Twitter to be part of the conversation.